In this article, I will introduce two different performance measurements that are commonly used in reporting returns. I will provide an introduction, explain the usefulness of each measure and then walk through an illustrative example showing how the two measures can differ.
Introduction
If we invest $1 and the return over one period is 5%, the return calculation is straight forward. If the period is one year, our return is 5% (annualized).
Things get more complicated when we have multiple periods of return and/or we have cash deposits and withdrawals over the return period for the performance calculation.
Time -weighted Return
In a time-weighted return calculation, we assume that $1 is invested. If any cash is deposited or withdrawn, we simply assume that for the next period, the base investment unit is still $1. We’ll get into more details on how to calculate the returns shortly. Where is time-weighted return used? Time weighted returns or (TWR) are typically used when evaluating the performance of an investment manager. For example, mutual funds and exchange traded funds are typically reported using TWR returns. Why? Well, the fund manager cannot control when clients are making investments or withdrawals. As a result, TWR is used to assess what the manager has control over – returns as if a fixed amount were invested at each point any cash enters or exits the fund. For clients of Brightwood Ventures, we use Morningstar Office and use the TWR reporting method.
Money-weighted Return
Money weighted return (MWR) is a measure which describes the return performance including the impacts of any cash deposits and withdrawals. Money-weighted return is also referred to as internal rate of return (IRR). MWR is useful in cases where the decisions of timing of the cash deposits and withdrawals are under the control of the person or entity being measured. For example, in evaluating project investments for a company, IRR is commonly used. For investors that are attempting to time the market with their cash flows, MWR (or IRR) may be a more appropriate measure.
Do the Measures Differ?
Normally TWR and MWR performance for investments are close to the same. When there are large differences in period to period returns and/or when cash deposits or withdrawals are large the return differences can be material. Next, I will walk through an illustrative example to demonstrate how the returns are calculated and how they can differ.
Illustrative Example
In this example, we are measuring performance over a three year period. Let’s assume $1 is invested at the beginning of year 1 and at the beginning of year 2. I chose one year periods as the annual return is easier to understand. Note that when we report investment return on a quarterly basis, cash deposits or withdrawals will have a similar effect as the example we are using with yearly data.
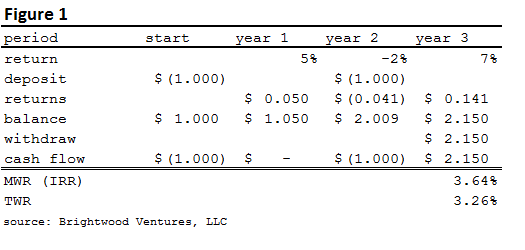
From Figure 1, I assume that a hypothetical portfolio returns +5%, -2% and 7% for years 1-3. I have included a breakout of the cash flows including deposits, withdrawals and returns. Next, I include the account balance and finally a summary of the cash flows.
In year 1, we deposited $1 at the start. The return was %% on the $1 for $.05 and the ending balance is $1.05. In year 2, we deposited another dollar at the start of the year. We had -2% return for the year, resulting in a loss of $.041. The ending balance for year 2 is $2.009. Note the cash flow is – 1.00, due to the additional investment. At the end of year 3, we assume that we withdraw all funds. (All figures are rounded to a tenth of a penny).
MWR measures the compound growth rate in the value of all funds invested in the account over the period. To solve for return, I used excel. For completeness, the equation to solve MWR is:
Ending Value = MV0(1 + R)^3 + CF1(1 + R)^3 + CF2(1 + R)^2 + CF3(1 + R)^3.
MV0 = is the value of the account at the beginning of performance measurement ($1)
CFn = Cash flow in the period
^ symbol means ‘raised to the power of’
MWR = 3.64%
The TWR calculation is easier. First we compound $1 over the three periods by the rate of return for each period and subtract the initial $1:
compounded ending value = [(1 + 5%) * (1 – 2%) * (1 + 7%)]
Next, we find the annualized TWR:
TWR = compounded ending value^(1/3) – 1 = 3.26%
MWR and TWR report different results due to the impact of cash flows in and out of the account.
Illustrative Example, Part II
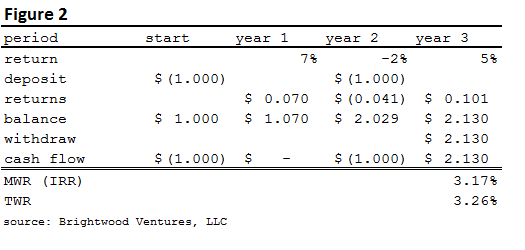
Let’s look at what happens if we simply vary the order in which we receive returns. In Figure 2, note that the only change we have made is to change the return order to 7%, -2% and 5%. We will use the same deposits and assume a full withdrawal at the end of the third year.
From Figure 2, we see that the TWR has not changed from the original 3.26%. If we assume a constant $1 investment with now cash flows during the measurement period, the order of the returns will not change the annualized TWR return.
MWR drops from the original 3.64% to 3.17%. What happened? Take a closer look at Figure 2. Notice that we only have $1 invested during year 1 when we have the higher 7% return in year 1. The timing of the returns combined with the timing of the cash deposits and withdrawals didn’t work out as favorably as they did in Figure1. The timing of the second deposit missed the strong year 1 returns. The second $1 invested experienced returns of -2% and 5% in Figure 2 compared with -2% and +7% in the figure 1. As a result, the MWR has fallen below the TWR of 3.26 to 3.17%.
Summary
In this post, I have introduced two different ways to measure investment performance, the time-weighted return (TWR) and the money-weighted return (MWR or IRR). We learned that TWR is typically used to evaluate investment managers as they do not have control over the timing of the investors’ cash deposits and withdrawals. This method assumes we compound returns of a fixed investment ($1) over the entire horizon. The money-weighted return (MWR or IRR) compounds the returns for all funds. This measure is appropriate when considering the timing of funds. With the example, we showed that the two figures can vary when there are large differences in period returns and/or when cash flows are large relative to the average balance.
Typically, investors don’t need to worry about the difference between the two measures. Knowing the basic logic and method to calculate the return series is useful for investors who like to go to the next level of detail in understanding how returns are calculated.

