
Through the middle of June, US stocks were up 4.7%. We have had some pretty large swings in equity prices, interest rates and the dollar along the way. Adding to that, fears of global trade wars, EU uncertainty and emerging market risk have been factors. Let’s take a look at total return year-to-date for key asset classes and stock sectors and look at the underlying factors that have contributed.
Strong Dollar, Rising Rates and Inflation
After falling over 9% last year, the US dollar has rallied 3.9%. Ten year treasury interest rates continued the climb they started last year and have risen to 2.93% from 2.4% at the end of 2017, after peaking at 3.11%. Through May, the CPI is up 2.5% over the past twelve months. Core CPI (excludes fuel and food) is up 2.1% year over year. Relatively benign May numbers and wage inflation at just 2.4% year-over-year, seem to be dampening market concerns about rising inflation.
Dollar strength has largely been driven by change in long-term growth expectations. At the end of 2017, forecasts were calling for coordinated global growth. Since then, expectations for international developed markets has declined. Emerging market currencies of Russia, Brazil, Argentina, Turkey and Mexico have been hit particularly hard. Rising interest rates and strong dollar are causing investors to pull funds from EM and invest in US.
Bonds
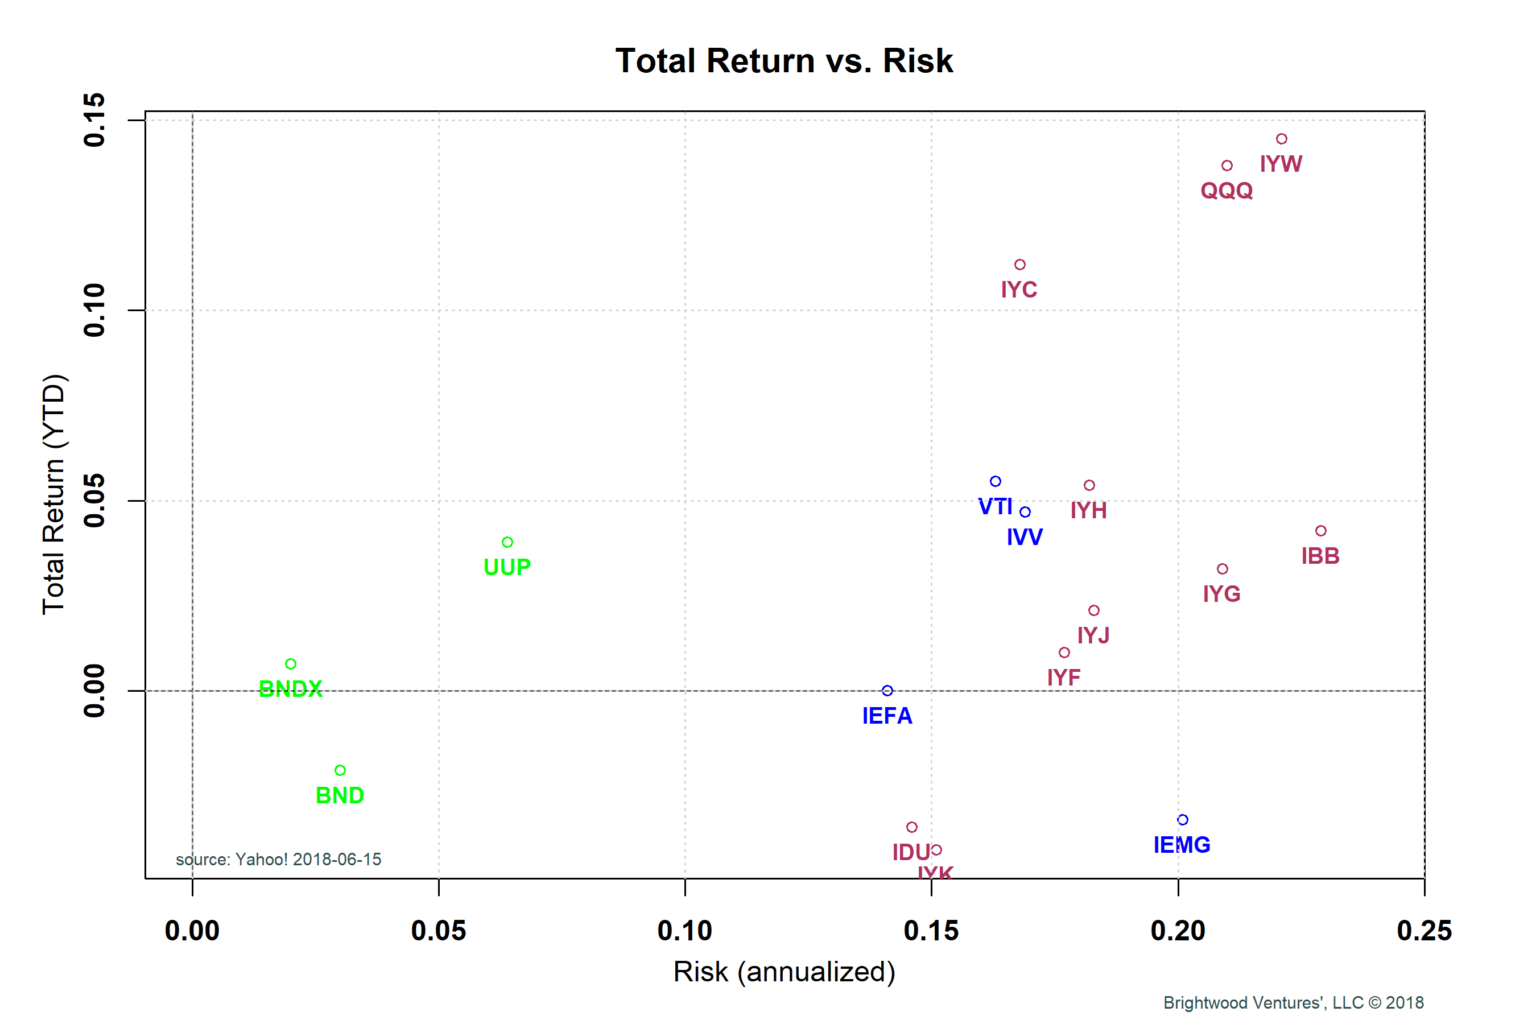
US bonds as measured by the Vanguard total US bond ETF (BND) are down 2.1% for the year. The rising rates noted above are the most significant factor. International bonds, as measured by the Vanguard total international bond ETF (BNDX), is up .7% for the year. US bonds are now paying 3.12% (SEC yield), while international bond ETF BNDX has an SEC yield of just .85%.
US Stocks
US stocks have been fairly volatile, driven by interest rates and trade war concerns. Earnings forecasts for the S&P 500 continue to rise for 2018, so that has been a plus. At the same time, the rising rates has put downward price pressure on stocks as required return rates trend up with interest rates. Still, on a forward PE basis, the market is trading below where we started 2018 at about 17x. Real Earnings Yield (‘REY’), previously discussed here, are currently at 1.8%. We’ll be watching the REY and changes in 2018 forecast earnings closely.
From the chart above, we see the US S&P 500 iShares ETF (IVV) with 4.7% return. The Vanguard total US stock market ETF (VTI) shows 5.5% return, indicating small and mid-cap stocks have outpaced the large caps by a small margin.
International Stocks
The iShares MSCI EAFE ETF (IEFA) track international developed country stocks (in their local currency). From the chart we see IEFA total return of 0%. The Investco DB US Dollar Index Bullish ETF (UUP) tracks the return of the US dollar vs. six development market currencies (euro, yen, British pound, Canadian dollar and Swiss franc). The UUP is up 3.9% YTD. Most of the difference between IEFA and IVV can be traced to dollar strength. Weakening growth expectations in Japan and Europe are also contributors.
Emerging market stocks have been hit harder. Total return for the iShares core MSCI emerging markets ETF (IEMG) is down 3.4% for the year. Again, currency changes are the biggest driver.
US Stock Sectors
Finally, let’s look at the iShares US sector ETF to understand which sectors are doing the best (and worst) in total return for the year. The technology sector comes out on top, by far. iShares technology ETF (IYW) and the Investco QQQ Trust ETF (QQQ) have returned 14.5% and 13.8%, respectively. The healthcare sector has also outperformed the overall market. iShares healthcare ETF (IYH) has returned 5.4% YTD. We continue to overweight both of these sectors. For more of a discussion on the diversification benefit of tech and healthcare check this prior post.
Utilities and consumer goods sectors have been hit the hardest. Of course, with rising rates, utilities suffer as bond interest rates become more attractive and drive required returns for these ‘bond substitute’ equities lower.