For the year, the total return for the S&P 500 is up about 10%. We are close to record territory. Is the market overvalued? Is it time to make adjustments? To dig into these questions let’s look at a justified PE given the earnings growth model. I introduced the earnings growth model here.
To answer the question ‘is the market overvalued’, we need to have some kind of reference point. Yes, by historical standards the PE ratio is high. At the same time, interest rates and growth are low. Inflation is in check. If growth, inflation and core interest rates remain low for a long period of time, the sustainable PE ratio will be higher.
Required Rate of Return
Let’s start with a simple assumption, that we require extra return for investing in the risky stock market. One simple way to come up with required return is to add a market premium to the long-term bond rates. Let’s say we think 10 year interest rates will remain low for a long period of time at 2-3%. This is well below the long term historical average, but given low population growth, limited productivity and an aging population, some economists argue that we could be in a prolonged period of growth that is well below historical averages. Let’s assume that our required rate of return should fall somewhere in the 5-8% range. Now, this seems like a narrow range, but as we will see shortly the justified PE ratio varies dramatically based on the assumptions we use.
Growth
In the earnings growth model, we need to also have an assumption for growth. Intuitively, we know that if a company is growing their earnings at a fast rate then we would be willing to pay more. The same holds for the market at large. Real GDP growth is hovering around 2%. Let’s just use that as our baseline assumption for future growth. Of course, if the growth in the future changes then it is likely our required return will go up. Why? Normally when the economy is growing we would expect more inflationary pressure and higher interest rates. As the interest rates go up, investors should demand a higher return to investment in the market.
Estimating Values
Unfortunately, it is very difficult to forecast future interest rates and growth. In addition, the justified PE varies greatly with changes to growth (g) and required return (r). In order to come up with a PE ratio that makes sense, I tend to like the prospective PE ratio as defined by Morningstar. This prospective PE ratio takes the asset-weighted average of company prospective PEs. The prospective PE ratio is the current price divided by the forecast earnings for the fiscal year.
S&P 500 Price / Prospective Earnings
Morningstar reports that for the etf IVV, which tracks the S&P 500 companies a price to prospective earnings of 20.39. Is this fair?
To help illustrate the discussion, I will use a graph that plots growth on the x-axis and PE ratio on the y-axis. Furthermore, what can we use to approximate future growth? While it isn’t perfect, one measure I like is the 3 – 5 year historical cash flow growth of the companies. Once again, this is reported by Morningstar.
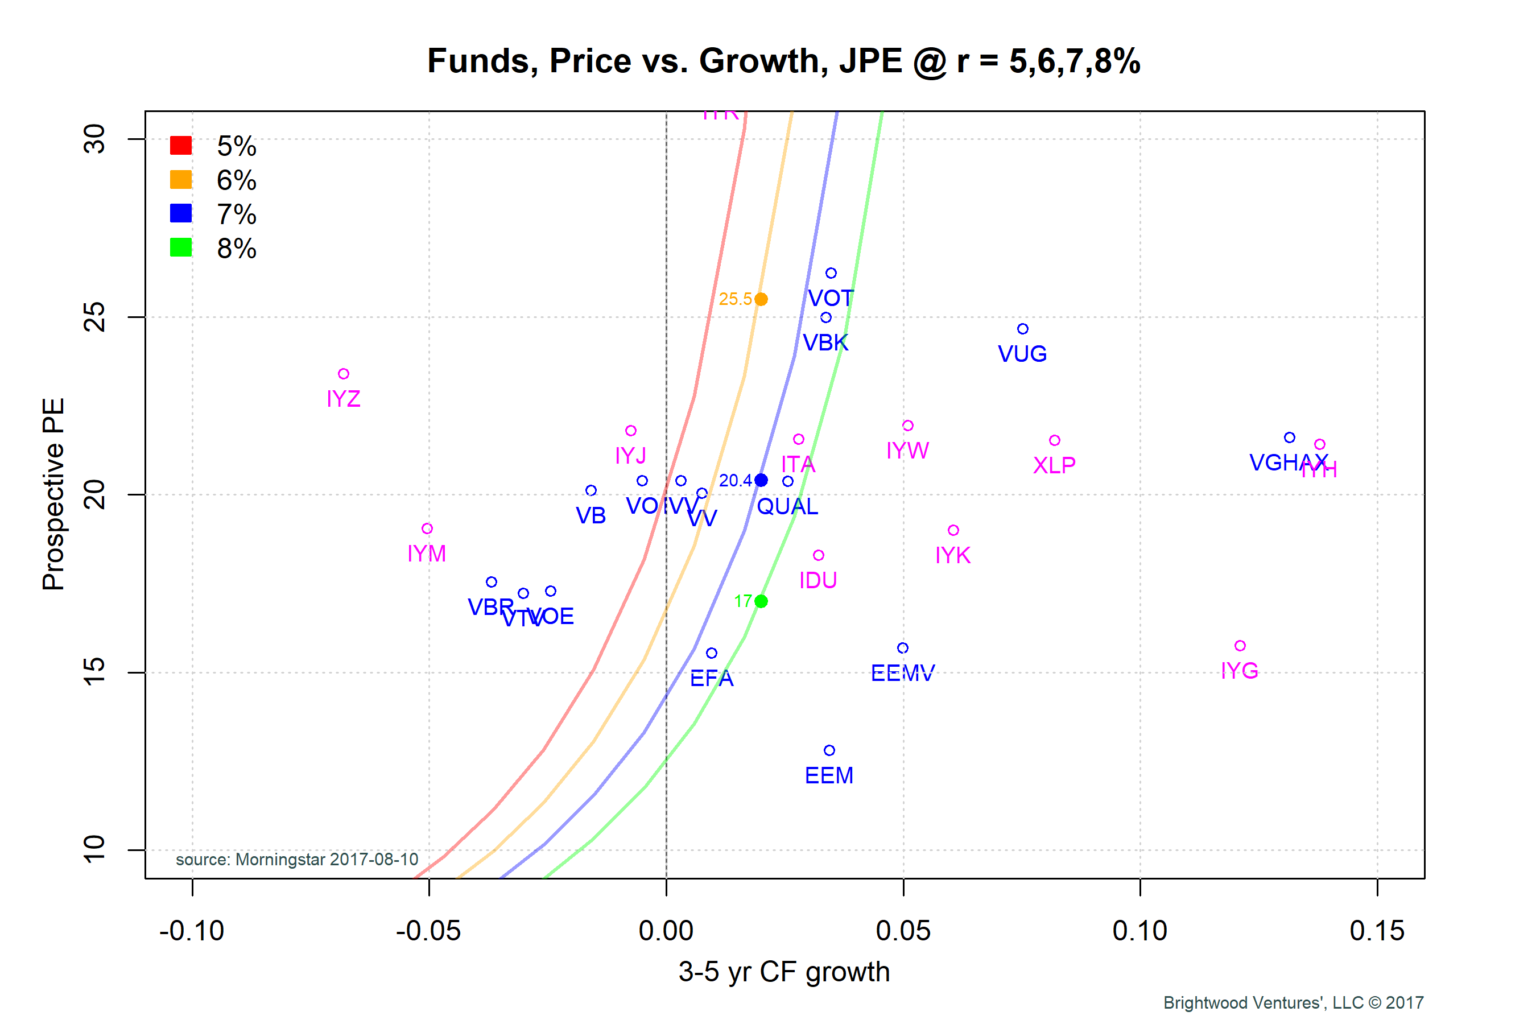
This is a busy graph so let’s break it down. What we have is a plot with growth and PE for various stock funds. The blue points are funds that I selected that are focused on specific asset classes. IVV is iShares S&P 500 fund. VUG is large cap growth stocks. VOE is mid cap value stocks. We can see IVV in the middle of the graph with a PE of about 20 and historical cash flow growth of ~0.
The magenta points are various iShares funds for sectors. For example, IYW is iShares US technology ETF.
Justified PE lines
I have plotted for additional lines on the graph for the justified PE ratio. Justified or ‘fair’ PE ratio is the PE ratio we should be willing to pay for a stream of earnings, given some assumption about required return and growth. The justified PE introduced previously is:
Price = E * (1 +g) / (r– g)
Where:
e = earnings per share
g = expected growth in earnings
We can restate the equation in terms of a P/E ratio as follows:
P/E(justified) = (1 + g) / (r – g)
On the graph, I plotted four different lines for justified PE ratio, assuming we use a required return of 5, 6, 7 and 8%.
Observation 1: Justified PE increases as growth increases
Focus on the justified PE lines. We can see that as growth increases the curves increase quickly. Look at the gold line with required return of 6%. With zero growth the justified PE is about 17. With growth of 2% that number goes to > 25.
Observation 2: Justified PE decreases as required return increases
Focus on an assumed growth of 2%. I added points on each of the justified PE lines to illustrate the next point. At 2% assumed growth the justified PE is 25. If our required return was 7%, we would only be willing to pay 20.4 for the PE.
The price we are willing to pay comes down to our required return and our assumptions about growth.
Observation 3: Asset Classes and Sector ETFs have high variation in prospective PE and growth rates
Notice we have sectors with both positive and negative cash flow growth. The telecommunications sector embodied in IYZ has declined (AT&T, Verizon, T-Mobile,…).
Tech stocks (IYW) have experienced stronger cash flow growth. The largest stocks in the IYW include: Apple, Microsoft, Facebook, and Google. As a group, these stocks have generated 5% growth in cash flows over the last 3-5 years. From the plot, we can see a general trend that funds with higher cash flow growth are trading at higher prospective PEs. Where a fund does not fit this model, the market may be suggesting that it views growth for these companies differently than historical cash flow growth estimates.
Observation 4: The higher the Justified PE, the greater the potential fall if required return goes up.
Not all prospective PEs are the same. We have heard the adage, ‘the higher you climb, the greater you will fall’. The prospective PE is not immune. To illustrate this, assume our required return goes from 6% to 7% or from 7% to 8%. In the first case, we would start at a PE of 25.5 and fall to 20.4, for a drop of 25% in the PE! If we started at the 20.4 (required return = 7%) and required return goes to 8%, we would expect a fall from 20.4 to 17. This is a 20% drop.
Market Valuation
I hope the detailed walk through and the graph have helped give some prospective on the question of market valuation.
Is the market overvalued?
If we assume that interest rates stay low and growth remains around 2% and we have a required return of 6-7% for stocks, then the earnings growth model suggests a justified PE of 20.4 is fair.
However, this PE is too high if interest rates or growth were suddenly to increase. Furthermore, since our starting point is ~20, of course a large increase in interest rates, inflation or some other sort of geopolitical fear (e.g. U.S. – North Korea saber rattling?), the market could easily correct by 10-20%.
All said, we remain invested, but our stance is cautious with a neutral market position. We are biased toward more defensive stocks (QUAL). We are dollar cost averaging new money. We could see cutting equity risk further if those prospective PE ratios don’t climb further.