Over the long run, stock market returns are highly correlated with GDP growth and corporate earnings. For the US S&P 500 stocks, earnings fell from $109.32 per share in 2014 to $92.24 per share in 2015. In this article, we will drill down on historical earnings, projections and discuss the impact this has on equity valuations and ultimately how we may shift tactical allocations in response.
Background Data
For this discussion, we will focus on US equities. Standard and Poor’s provides historical and forecast (consensus) data by sector for US stocks defined by their stock indicies. Data includes items such as operating earnings, GAAP earnings, sales and forecast earnings. This discussion focus will be on the S&P 500 companies with data derived from the S&P 500 Earnings and Estimate Report from April 13, 2016.
S&P 500 Earnings Trend
Let’s start by looking at the historical quarterly earnings per share for the S&P 500 companies along with the price (adjusted for dividends) of the SPDR S&P 500 Exchange Traded Fund (ticker: ‘SPY’). The chart below includes price on the left axis for SPY. They y axis has the quarterly per share aggregate earnings. We can see the earnings ‘stair step’ for quarterly reported earnings through Q4 2016. The final step is the estimated earnings per share for Q1 2016. This is an estimate because not all of the S&P 500 companies have reported earnings as of today. Finally, in addition to the earnings ‘stair step’ I have included a trend line for earnings. Briefly, this trend line comes from a linear regression of earning over the entire period.
I would like to make a few observations. First, we can see that although earnings are volatile over time, the price of the equity fund generally corresponds to the shape and trend of the earnings stair step. Second, the long term trend over the period shows that earnings have grown at rate of 9.1% since the beginning of 2008. However, note that recent earnings appear to have flattened out and/or is actually declining. For 2016, the year over year earnings fell by roughly 15%. A number of factors contributed to this decline.
Strong Dollar
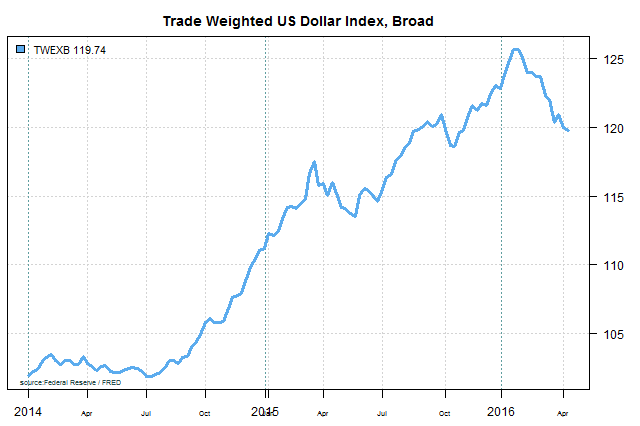
One of the big drivers for soft earnings in 2015 was the strong dollar. In particular, for US companies that sell their products abroad the strong dollar means that foreign consumers need to pay more in local currency terms. Companies revenues are impacted as sales go down and/or they are forced to make price concessions to ensure that they don’t lose market share. Companies such as Microsoft, Proctor & Gamble and Pfizer are just a few examples of companies that noted the strong dollar negatively impacted their sales in 2015.
Recently, the dollar has weakened from its recent highs and the US market rally has been partially attributed to a weaker dollar.
S&P 500 Earnings By Sector — Cyclicals
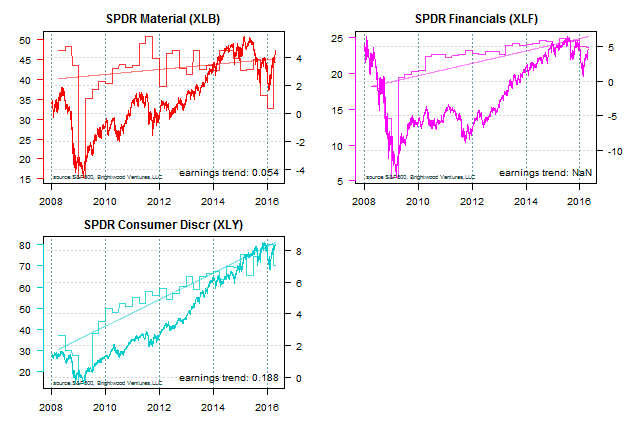
Next let’s look at per share earnings broken down by sector. First we will look at the Cyclicals. For this discussion we are using Morningstar’s categorizations. Cyclical industries are generally the most impacted by swings in the economy. Typically, beta for stocks in these sectors is greater than 1, meaning that they vary to a greater degree than the S&P 500 at large. Recent trend growth in per share earnings appears to be below long term trend for the materials and financial sector. Trend for consumer discretionary isn’t quite as clear. Note the large drop in earnings for all three of these sectors during the 2008 financial crisis.
S&P 500 Earnings By Sector — Sensitives
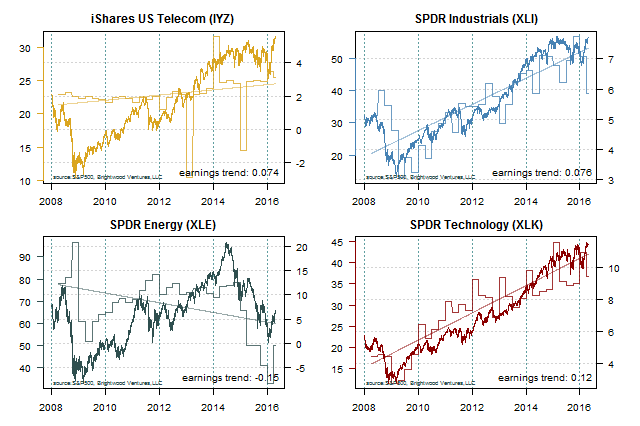
Sectors found in the Sensitives sector vary with the business cycle but to a lesser degree than the cyclicals. Beta for these sectors tends to be close to 1, or roughly the same level of risk as the market at large. Here we find the telecommunications, industrials, energy and technology sectors. Telecom per share earnings appears highly variable. Industries and technology trend appears to flatten in 2015. This is partially explained by the strong dollar. Energy shows very significant weakness. Of course, this is largely driven by the large drop in oil prices. Fears of slow global growth with focus on China, large increases in production and flat demand all contributed to declines in oil. Oil companies represent about 7% of the S&P 500, so they have clearly impacted the total earnings picture as well.
S&P 500 Earnings By Sector — Defensive
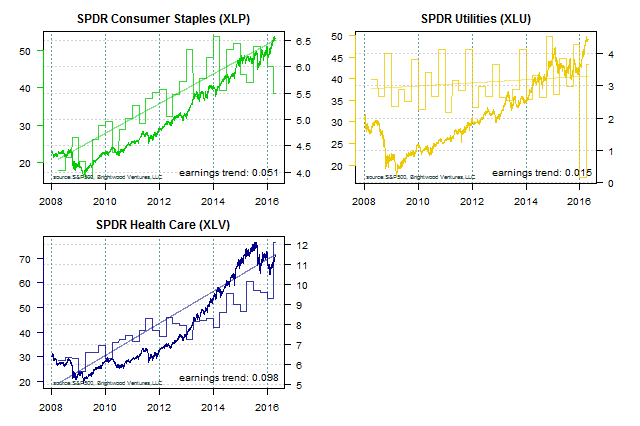
Defensive sectors include consumer staples, healthcare and utilities. These sectors are considered to be the least sensitive to economic cycles. Proctor & Gamble, Pepsi and Mondelez International (including the Kraft brand of product) are examples of consumer staples. The idea is that households maintain consistent spending on these sectors even when economy softens. Note from the chart how much lower the decline in earnings per share was for these sectors during the financial downturn in 2008.
At the end of 2015, noting a softness in earnings and the start of Fed Funds rate increases, we adjusted our model portfolios to increase the weight we put toward quality stocks (generally more defensive names) and added (increased) exposure to US healthcare. Trend growth in healthcare has been strong. Also, if we are coming to the end of the business cycle, in the event of a downturn, we would expect these sectors to perform relatively better than the cyclicals or sensitive sectors.
Economic and Earnings Outlook
Recent trend growth in real GDP has been tracking at about 2%. The Federal Reserve Open Market Committee (FOMC) is projecting real GDP growth for the US at 2.2%, 2.15% and 1.95% for 2016, 2017 and 2018, respectively. (source: FRED, updated 3/16/2016.
Based on data provided by S&P, the consensus earnings estimates based on bottoms up forecast for the S&P 500 companies project per share earnings for 2016 will be $117.47. This would represent a 27% increase of 2015 earnings or 7.4% increase over 2014 earnings.
On a cautionary note, the ‘bottoms up’ forecast is derived from analyst estimates. These estimates typically start high and are adjusted downward over the course of each quarter. Looking at how these forecasts trend over time can be instructive, but is beyond the scope for this brief update.
Valuation
As investors, we keep watchful eye on earnings and earnings growth and what it costs us to participate in the earnings of the companies we hold directly and indirectly via funds. Where do we stand on valuations?
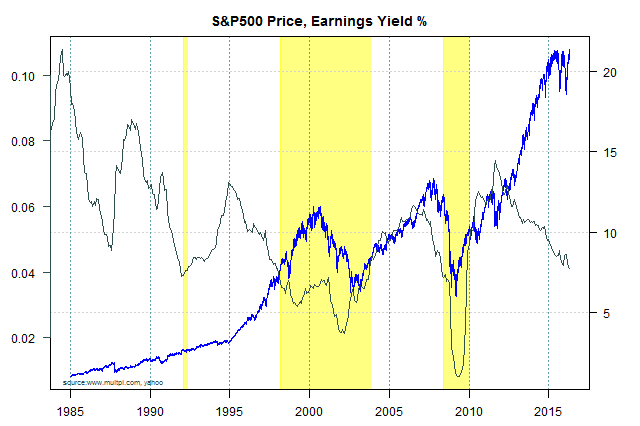
Clearly, with a fall in earnings from peak earnings in 2014 and stock prices near record highs, valuations are becoming less attractive. The next chart shows the earnings yield for the S&P 500. Earnings yield is just the inverse of the P/E ratio. Essentially, if we view earnings like the interest on a bond it gives us one way to compare investments across asset classes.
The chart below plots the earnings yield on the left axis vs the relative price (adjusted for dividend) for the S&P 500 fund (Vanguard VFIAX). I have highlighted those regions where the earnings yield is below 4%. This is equivalent to a PE ratio greater than 25.
Since 2005, we can see there have been 3 periods where PE ratio went above 25. In two of the cases, a large drop in price occurred in the highlighted range. The late 90s were an amazing time for stocks. I was in the eye of the storm doing equity investments for Intel. Valuations were stretched for large public companies. For startups, valuations become unsupportable. It sounds easy to say things are too expensive and I’ll sit out, but look at the chart. PE ratios exceeded 25 early in 2008. The market didn’t peak / fall until two years later! The market rose another 25% before losing 55% of it’s value.
Currently, we are PE of 24.17 (yield = 4.14%). Ten year treasuries are yielding 1.86% and investment grade corporate bonds are yielding about 3%. From this point forward, if the economy grows at the projected 2% level, interest rates remain low and earnings track GDP growth, then equities may very well provide a premium to holding bonds. Of course, the return will be very low. Roughly 2% dividend yield, 2% inflation and 2% real growth suggests a 6% return before any changes in PE.
That said if economic growth falls and/or we get significant increases in interest rates a correction would be very likely. All said, as valuations continue to rise the risks are becoming asymmetric. Any upside is likely to be low compared to size of a potential correction.
Conclusions
Earnings are weak, but are projected to recover. GDP growth is low, but resilient. Valuations are stretched and earnings yield is getting very close to the historic lows. We are at a crossroads. If valuations go much higher, asymmetric risk may be too great for the weak potential return. On the other hand, if growth and earnings meet consensus the situation could improve.
It is very difficult to forecast earnings and/or time markets. First and foremost, we maintain well diversified model portfolios with very healthy portions of bond assets. Second, we make tactical adjustments based on macroeconomic, business cycle and valuation analysis. As such, we have already shifted our equity weighting toward defensive sectors. Finally, if valuation stretches above PE 25, we would consider reducing our equity beta even further by either increasing defensive sector weighting further or going to cash. This decision would be driven by examining the valuations for the defensive sectors in question.

