
Each year we develop capital market expectations. These expectations are used to review and/or modify our model portfolio asset allocations. In addition, we use these to understand the risk-return characteristics of global asset classes.
In this article, I will provide an executive summary of asset class risk-return assumptions and the key drivers for these assumptions. In Part 2, I will discuss strategic asset allocation and efficient portfolios based on the assumptions.
Methodology
To develop these expectations a wide range of sources are used. Wealth management firms JP Morgan , Research Affiliates and GMO generate market returns and we use these as the core starting point. We also consult a wide range of industry and economic data sets such as those from The Federal Reserve and the International Monetary Fund.
We use the detailed correlation matrix from JP Morgan and make adjustments to the return expectations. As a general rule, the return expectations from JP Morgan have been higher than the GMO and Research Affiliates estimates over the past 2-3 years. The Brightwood Ventures final expectations have tended to be lower than JP Morgan but higher than GMO and RA. For 2017, JP Morgan has lowered their expectations.
Key Macro Economic Drivers
• Aging population with slow growth
• Increasing inflation closer to central bank target rates
• Low rate environment with gradual increases from current levels
JP Morgan holds the view that low population growth will hold developed country real economic growth at 1.5%. US real GDP growth has averaged close to 2% over the past 3 years. JP Morgan commented that, ’Persistently weak productivity creates further downside risks to our long-term growth estimates.’ In a previous article I noted three year US productivity has been running below 1%.
The significance of these estimates for equity markets are significant. As a basic starting point for long term equity returns, we would expect equity returns to be a function of nominal economic growth. Nominal growth is the combination of inflation and real GDP growth.
As far as US inflation, I like to look at trimmed mean PCE inflation rate. For the US, inflation is currently running at 1.7%. It is important to note that the Federal Reserve has a 2% inflation target. The assumption made in the JP Morgan model assumes that the US Fed and other central banks are successful in driving monetary policy to achieve target rates. JP Morgan assumes 1.75% inflation for developed markets and 3.75% for emerging markets. US inflation expectations are 2.25.
Going forward, my expectation is that the inflation assumptions may come in lower than expectation.
Asset Class Returns
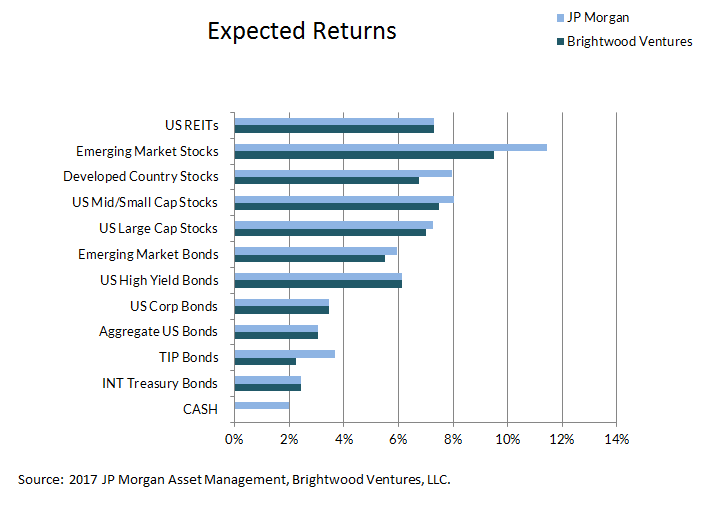
The following table shows a partial list of asset class return assumptions comparing JP Morgan and Brightwood Ventures estimates. These return expectations are based on average annual returns.
Brightwood estimates are largely in line with JP Morgan. Three asset classes are worth noting. For US large cap stocks, JP Morgan lowered expectations to 7.25% down from its 2016 estimate of 8%. Brightwood Ventures estimate is 7%. A 7% mean return would generate 6.25% compounded return. My estimate is lower than JP Morgan based on an expectation of slightly lower inflation expectation of 2% in the US.
My assumption for developed countries outside of the US is 1.25% lower than JP Morgan estimates. In short, I think the developed EU countries will continue to struggle to hit their GDP growth targets and political uncertainty will continue to be a drag. For Japan they have constantly struggled to reach inflation and GDP targets under the weight of a rapidly aging population.
For emerging markets, my estimates are 2% points lower based on lower GDP and inflation expectations coupled with my view that commodity prices will continue to remain under pressure.
The following chart plots risk and return for select securities and assets. First, for reference, I included the 3 year compounded return of certain exchanged trade funds that represent core asset classes (magenta).
Next, we have Brightwood estimated mean return and risk for core asset classes (blue). Finally, I included efficient frontiers and select model asset class portfolios (red).
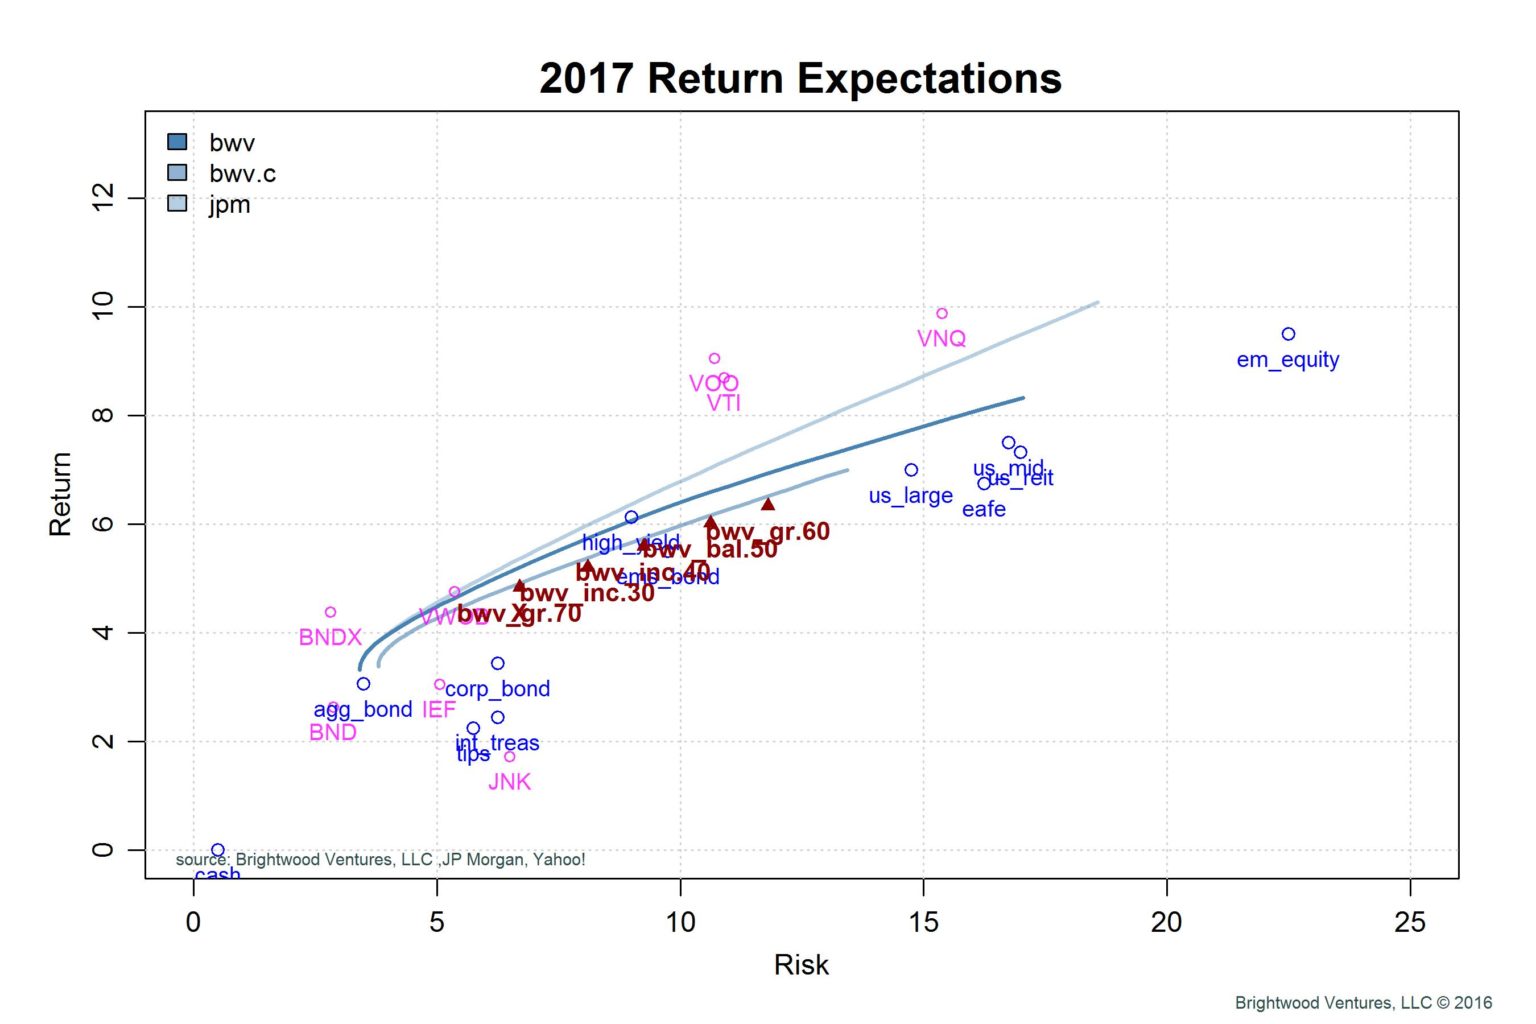
In Part 2, I will go into more detail on the efficient frontier lines and the target portfolios.